Dashboard, glossary and Map
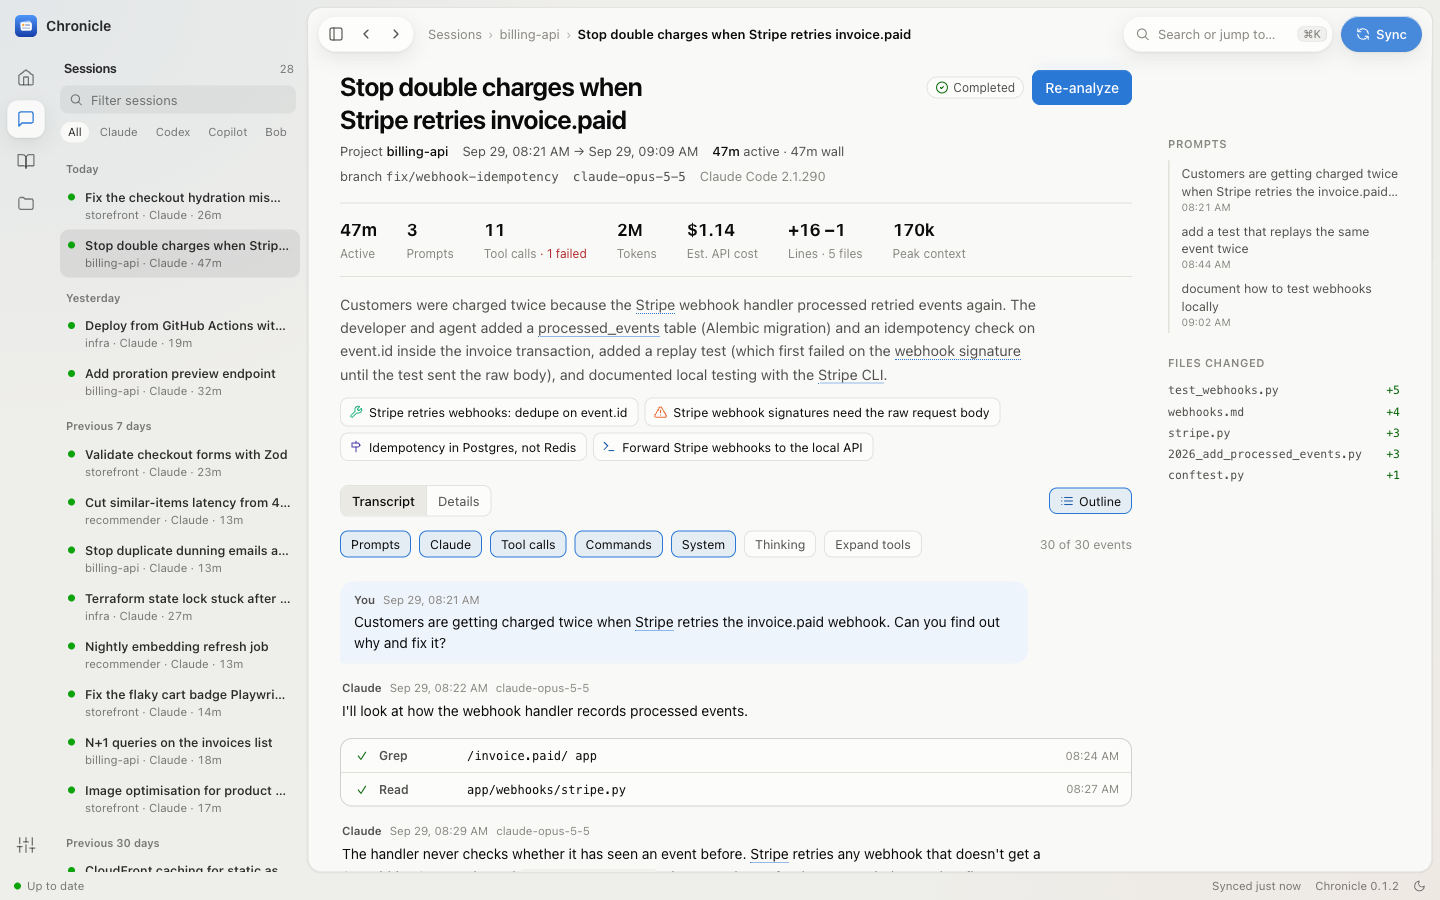
Dashboard: a simplified VS Code layout in Apple's Liquid Glass style. An icon rail on the left switches between
Home, Sessions, Knowledge, Projects and Settings, and the sidebar beside it lists that section:
recent sessions grouped by the day they were last active, with agent filters, knowledge kinds with counts plus Glossary, Map, Global playbook
and Weekly reviews, projects, or Status, Sources and Appearance. ⌘K (also ⌘P or /) opens a palette that jumps
to any session, knowledge item, project, glossary term or page and runs commands (sync, rebuild the glossary, group
themes, switch theme); ⌘B hides the sidebar. The status bar shows background work, the analysis queue, the
last sync and, once one is found, an available update (Updating).
Glass is kept to the navigation layer (rail, sidebar, toolbar, palette, the Map's floating controls);
pages sit on a solid surface. Settings › Appearance picks the theme and turns on Reduce transparency; the app
also follows the macOS setting of that name.
Keyboard shortcuts
| Keys | |
|---|---|
⌘K, ⌘P or / |
Search or jump to any session, knowledge item, project, glossary term or page; run commands |
| ↑ ↓, ↵, Esc | Move through the palette's results, open one, close it |
| ⌘B | Show or hide the sidebar |
| Esc | Close the palette, or the sidebar on a narrow window |
Ctrl replaces ⌘ outside macOS. In the macOS app, drag the window by its toolbar; double-click the toolbar to zoom.
Pages
Pages: Home (active-time headline with active days and longest run; stat tiles with sparklines and a per-day rate until a full prior period exists to compare against; daily chart with a 7-day average; outcome breakdown; activity calendar with streaks; busiest hour; projects, tools with failed calls, models and agents), a sortable, filterable session list, project cards with 12 weeks of activity, session pages (headline figures, the summary and the knowledge it produced up top, then Transcript: the conversation with one-line tool calls that expand to their input and output, and subagent threads; or Details: goal, highlights, open threads, the knowledge items, context-window chart with compactions, tools, files, subagents, PRs; on wide windows an Outline of the prompts and changed files sits beside the transcript and follows your scroll), a Knowledge overview (one card each for the Map, All knowledge, the Glossary and Weekly reviews, with a glance at what is inside), knowledge browser (pin/dismiss), project knowledge bases and the global playbook (a TL;DR, section chips, a filter, and sections as cards of short bullets that open to their detail and sources), glossary, a mindmap of the glossary (see Map below), weekly reviews (one week at a time: a three-line TL;DR, the week's numbers against the week before, active time per day, where the time went, outcomes and knowledge captured, then themes and short lists of what shipped, what was learned, what is still open, what slowed you down and what to try next; the full write-up is folded away), search with jump-to-message. Glossary terms are underlined wherever they appear (transcripts, knowledge, summaries): hover for the definition, click for the entry. Every chart has a table view; light and dark themes.
Glossary
built by the analysis model from each project's distilled knowledge (not the raw transcripts), one call per project plus a cross-project pass, refreshed whenever a project's knowledge base is re-synthesized. Each term has a category, aliases (abbreviations, translations of Japanese business terms), a definition, a per-project usage note, related terms, and full-text statistics: how many sessions mention it, first and last seen, top sessions.
Map
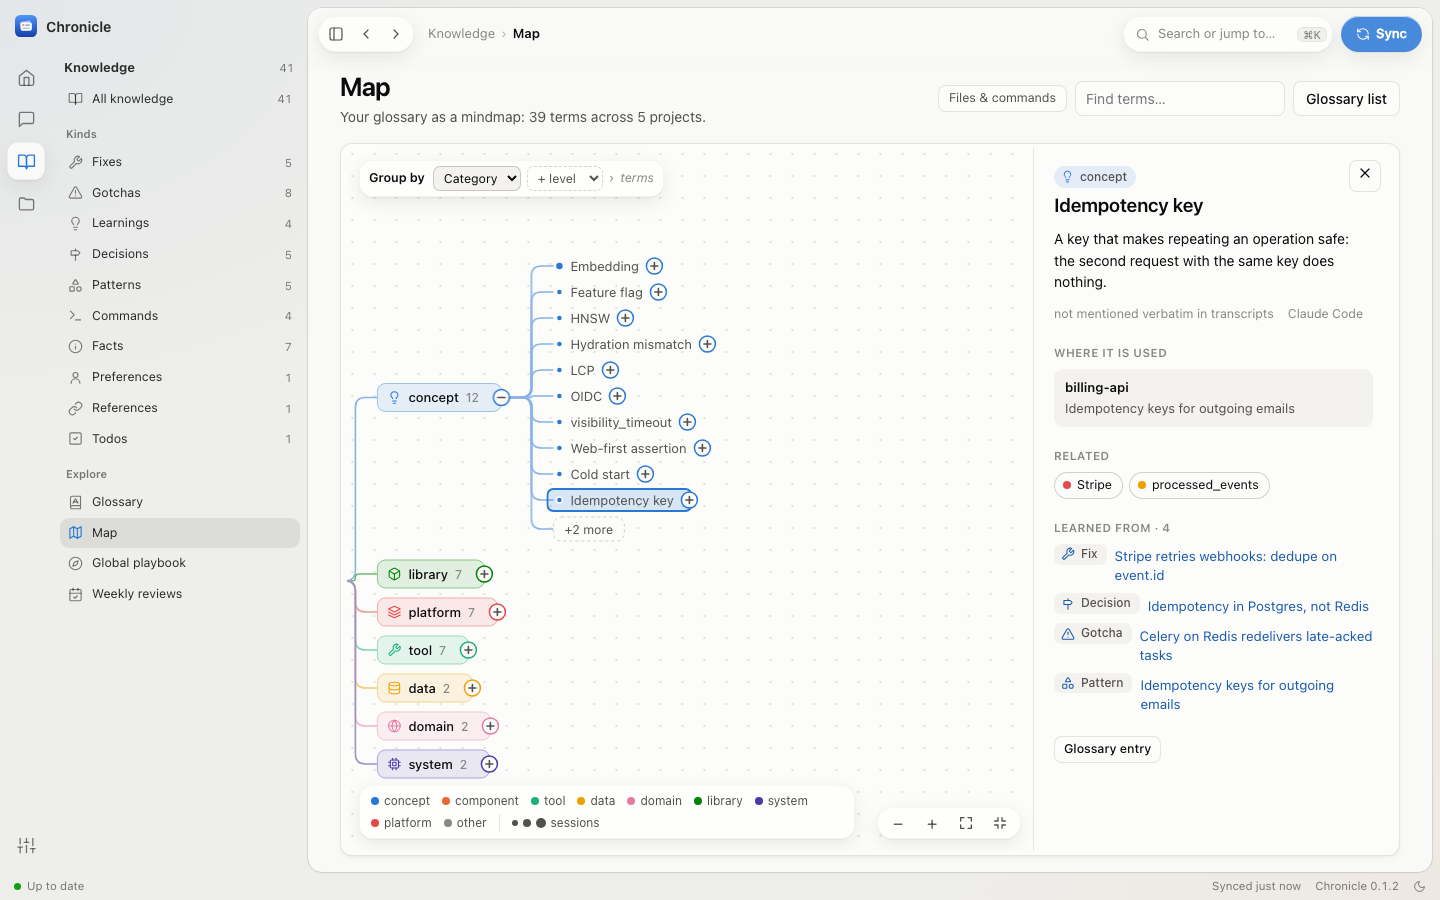
The dashboard's Map page draws the glossary as a collapsible mindmap. Group by (top left of the
map) stacks any of four levels in any order: Category, Theme, Project and Agent (the agents whose
sessions taught the term), with terms last. The side panel's Views offer common stacks (Category › Theme,
Project › Category › Theme, Category › Project, Agent › Category › Theme). Terms open into the knowledge items they
were distilled from and the sessions that mention them most. Click a node to open or close it and see its details:
a term's definition, where each project uses it, related terms (click to jump there), its knowledge and sessions;
a category's themes; a theme's description. Drag or scroll to move, pinch or ⌘-scroll to zoom; the view glides to
keep an opened branch on screen. Find terms (Enter) opens every match at once: terms whose name or alias has
all the words, terms whose definition mentions them, and themes, categories, projects or agents named that way.
Branches along the way show only the path to a match (the rest stay under +N more), matches are highlighted, and
the side panel lists them grouped (Groups, Named, Mentioned in the definition), each a click away; a single match
opens straight to its details. The search stays in the link (q=), so a reload or a change of Group by keeps
it; clear the box or close the panel to leave it. Colour marks the category (the eight largest
have their own hue, the rest share grey; project and agent levels are neutral); a term's dot grows with the number
of sessions that mention it (1, 2–4, 5+). File names and commands are hidden until you turn on Files & commands.
No branch draws more than 10 children (12 at the top; a term shows up to 6 knowledge items and 4 sessions): the
most-discussed come first, and +N more lists the rest in the side panel, filterable as you type, where picking one
adds just that node to the map (related-term links do the same). Every glossary entry links to its place
on the map (on the map →).
Themes
The analysis model splits each glossary category with 25 or more terms into 4–10 named themes (for example concept →
"Cloud infra, auth & integrations", "Agent dev workflow & tooling"), one call per category, so no level of
the map is a long list. Themes are rebuilt after glossary rebuilds, only for categories whose terms changed; terms
added since then show as Not grouped yet. Run it by hand with chronicle glossary --themes [--force] or the
Group into themes button in the map's side panel. On a 1,360-term glossary, the ten big categories cost about
$1.40 API-equivalent in total.